The percentage of Americans without health insurance dropped by nearly three percentage points between 2013 and 2014, according the U.S. Census Bureau, from 13.3 to 10.4 percent. Put another way, 8.8 million more people were insured in 2014 than the year before.
The annual study from Census is considered the definitive measure of health insurance, although a change in the way health insurance questions are asked make this year’s report comparable to 2013 but not earlier years.

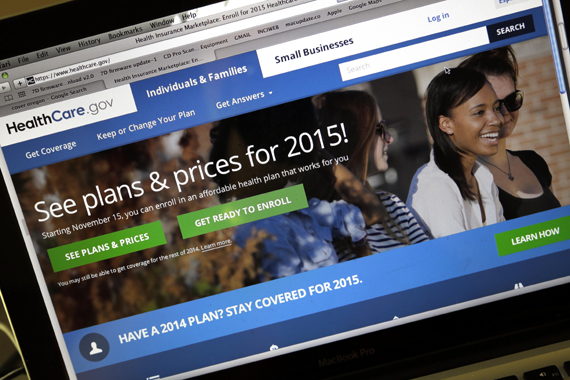
Healthcare.gov is shown during open enrollment in 2014 for signups for 2015 health insurance plans. In part due to enrollments using healthcare.gov, the uninsured rate in the U.S. dropped to 10.4 percent. (Photo by Don Ryan/AP)
Census officials, however, point out that a different annual survey that has asked health insurance questions consistently show this to be the biggest drop in the uninsured since at least 2008.
Others say the sizable increase in Americans with insurance – due in large part to the implementation of the federal health law – is unprecedented since the creation of Medicare and Medicaid 50 years ago.
“It’s probably the biggest drop ever,” said Paul Fronstin, director of health research at the Employee Benefit Research Institute, who has been studying the uninsured since 1993.
“For the general population, this is a historic drop,” agreed Diane Rowland, head of the Kaiser Family Foundation’s Commission on Medicaid and the Uninsured. (Kaiser Health News is an editorially independent program of the Foundation.)
More importantly, said Rowland, “the gains are exactly where the biggest problems were,” meaning the largest increases in coverage were in those groups with traditionally the highest rates of uninsurance – younger, working-age adults and people with low and moderate incomes.
Despite the gains, the Census study found that 33 million people are without insurance.
While the gains in insurance coverage were widespread, they were not equal in every category. Not surprisingly, among types of coverage, the biggest increases were in people covered by Medicaid (up 2 percentage points to 62 million people) and people buying their own health plans (up 3.2 percentage points to 14.6 million people). Expanding Medicaid and making private insurance easier to purchase by those without employer coverage were key focuses of the health law.
But the largest single source of health insurance remains that provided by employers. That number held steady at around 55 percent.
The uninsured rate dropped for every age, income and ethnic group and in every state, although, again, some gained more than others.
Those at the lower end of the income scale were more likely to gain insurance than those with more resources. The uninsurance rate for households earning less than $25,000 per year dropped 4.3 percentage points and the rate for those with incomes between $25,000 and $50,000 dropped 5 points. The uninsurance rate for those earning more than $100,000 annually dropped too, but by less than a percentage point. Most of those people, however, were already insured.
Similarly, the uninsured rate for the white non-Hispanic population (the ethnicity most likely to have insurance) dropped by just over 2 percentage points, while the rates for blacks, Asians and Hispanics dropped by more than 4
percentage points each.
Among states, Massachusetts (which began requiring most people to have insurance in 2006) had the lowest rate of people uncovered, at 3.3 percent, while Texas continued to lead the nation with the highest uninsured rate, 19.1 percent.
States that expanded Medicaid, however, saw overall gains in insurance – not just Medicaid – that were larger than those that did not. For example, people with incomes above poverty but less than four times that (most of whom are not eligible for Medicaid) still saw an overall decline in uninsurance of 6.4 percentage points in states that expanded Medicaid, while states that didn’t take that option saw that rate drop by only 4 percentage points.
Rowland suggests that “reflects the push in those states to get people insured, above and beyond (Medicaid) expansion.”


